What is JVM in Java – A Comprehensive Guide
Have you ever noticed that programming languages like C and C++ require compilation before running? This takes place in order to convert the language to the platform-specific code. Hence, they come under the list of compiled languages.
On the other side, we can execute languages like JavaScript and Python directly without compiling. These languages come under the list of interpreted languages. When comes to Java, uses both techniques. And this is where the JVM or the Java Virtual Machine plays a major role. In this article, we will get to know about it in detail.
What is JVM in Java?
The Java Virtual Machine or the JVM is a run-time engine to run Java applications. Whenever you add a main method to a program, the JVM is the one that calls it. JVM is a part of JRE (Java Runtime Environment).
The role of the JVM is to decipher the bytecode that assembles from the java source code. It refers to the proper execution of the particular with a firm instrument set and a comprehensive memory model. This usage of JVM is termed ‘HotSpot’.
Irrespective of the platform, the Java coding can be written once and run anywhere. All it requires is that the system should be a Java-enabled one. This is possible due to the presence of JVM.
JVM Architecture in Java:
The Java Architecture consists of three main subsystems:
1. Java ClassLoader Subsystem
2. Runtime Data Area
3. Execution Engine
Let us see each of them in detail now:
1. JVM ClassLoader Subsystem:
The class loader subsystem carries out three main activities:
- Loading
- Linking
- Initialization
a. Loading:
The Classloader reads the ‘.class’ file and generates the corresponding binary data and saves it. Here is the list of information that the JVM stores for each .class file in the method area:
- The full name of the loaded class and its immediate parent class.
- If the ‘.class’ file belongs to Class or Interface or Enum.
Once the ‘.class’ file is loaded, the JVM creates an object of type Class to represent this file in the heap memory. This object would be of type Class as predefined in the java.lang package. We can use this object to obtain details like class name, parent name, methods, and variables. The getClass() method of the Object class is used to accomplish this.
Sample program to demonstrate working of Class type object:
import java.lang.reflect.Field;
import java.lang.reflect.Method;

public class FirstCodeTest{
    public static void main(String[] args)
    {
        Student s1 = new Student();
        Class c1 = s1.getClass();

System.out.println(c1.getName());
        Method m[] = c1.getDeclaredMethods();
        for (Method method : m)

System.out.println(method.getName());
         Field f[] = c1.getDeclaredFields();
        for (Field field : f)

System.out.println(field.getName());
    }
}

class Student {
    private String name;
    private int roll_No;

    public String getName() { return name; }
    public void setName(String name) { this.name = name; }
    public int getRoll_no() { return roll_No; }
    public void setRoll_no(int roll_no)
    {

this.roll_No = roll_no;
    }
}
Output:
Student
getName
setName
getRoll_no
setRoll_no
name
roll_No
Note: For each loaded “.class” file, only one object of the class is created.
Student s2 = new Student(); // c2 will point to same object where c1 is pointing
Class c2 = s2.getClass();
System.out.println(c1==c2); // true
b. Linking:
It performs verification, preparation, and resolution.
- Verification:
It makes sure that the correctness of the .class file. It checks if the file is formatted and generated by a valid compiler or not. We would receive the java.lang.VerifyError exception if the verification fails. The ByteCodeVerifier component carries out this activity. Once this is over, the class file will be ready for compilation. - Preparation:
The JVM allocates memory for the class data members and initializes the memory to default values. - Resolution:
This process replaces symbolic references from the type with direct references.
c. Initialization:
In this stage, all the static variables are assigned to the values given in the code and static block. It is executed from top to bottom in a class and from parent to child in the class hierarchy. There are three class loaders present:
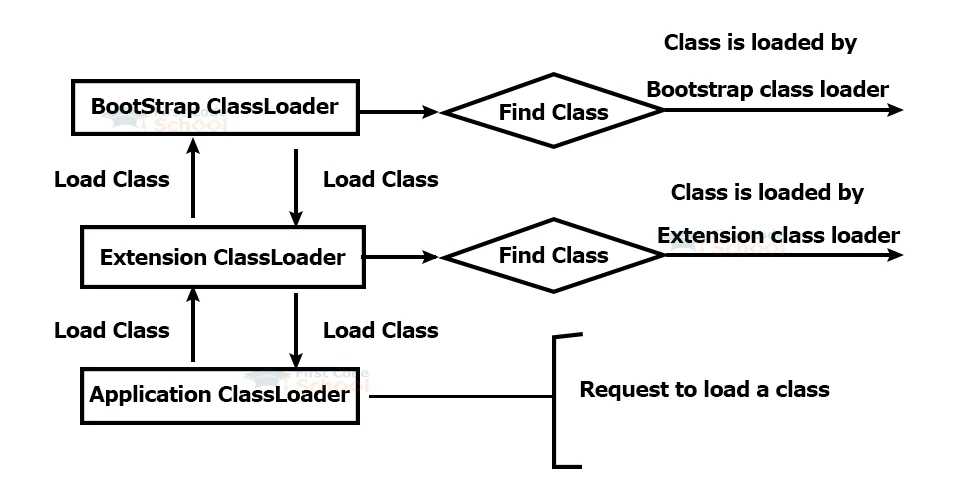
- Bootstrap class loader: The bootstrap loader is responsible for loading trusted classes. It loads core Java API classes that are located in the “JAVA_HOME/jre/lib” directory. This path is also known as the bootstrap path is implemented in languages like C and C++.
- Extension class loader: This class is the child class of the bootstrap class loader. It loads the classes that are present in the extension directory “JAVA_HOME/jre/ext”. it also loads the classes that are available in other directories that is mentioned by the java.text.dirs system property.
- System/Application class loader: This class is the child class of the extension class loader. It loads the class from the application classpath. It makes use of the Environment Variable that is mapped to java.class.path. It is also implemented by the sun.misc.Launcher$AppClassLoader class.
Sample program to implement Class Loader Subsystem:
public class FirstCodeTest {
    public static void main(String[] args)
    {
        // String class is loaded by bootstrap loader, and bootstrap loader is not Java object, hence null

System.out.println(String.class.getClassLoader());

        // Test class is loaded by the Application loader

System.out.println(Test.class.getClassLoader());
    }
}
Output:
null
jdk.internal.loader.ClassLoaders$AppClassLoader@8bcc55f
Note:
Here, the JVM follows the Delegation-hierarchy principle to load the classes. System class loader delegates load request to the extension class loader and extension class loader delegates request to the bootstrap class loader. If a class is found in the boot-strap path, the class is loaded otherwise request again transfers to the extension class loader and then to the system class loader. In the end, if the system class loader cannot find the load class, a run-time exception is java.lang.ClassNotFoundException occurs.
JVM Memory Model:
It has below components:
1. Method area:
It stores all the details like the class name, immediate parent class name, methods and variables information etc. The one method area per JVM acts as a shared resource.
2. Heap area:
It stores the details regarding the objects. Each JVM has a Heap Area that acts as a shared resource.
3. Stack area:
It creates a one-time stack for every thread and stores it here. The stack frame is further divided into three sub-parts:
a. Local variables– Here, every frame contains an array of variables known as local variables. All the local variables along with their values are stored here. The length of this array is decided during the compile time.
b. Operand Stack – Each frame consists of Last-In-First-Out (LIFO) stack known as an operand stack. It acts as a runtime workspace to perform the intermediate operations. Here, the stack’s depth is analyzed during the compile time.
c. Frame Data – All the symbols related to the method are stored here. This stores a catch block of information in the event of exceptions.
4. PC Registers:
It stores the address of the current execution instruction of a thread. It is obvious that each thread consists of separate PC Registers.
5. Technique Area:
This area is also known as the permanent age where all the stacked classes are put away. It has been expelled from the JVM, and the classes are currently stacked as metadata to the local memory of the basic OS.
6. Native Method Stacks:
For each thread, a distinct native stack is created to store the native method information.
JVM Execution Engine:
The execution engine executes the “.class” (bytecode). The purpose of it is to read the byte-code line by line and use the data and information that is present in the memory area. These details are further used to execute various instructions. We can classify an execution engine into three parts:
- Interpreter
- JIT Compiler
- Garbage Collector
1. Interpreter:
It interprets the bytecode line by line and executes. Each time when a method is called, an interpretation is required. This is a major disadvantage.
2. Just-In-Time Compiler(JIT):
It increases the efficiency of an interpreter. as it compiles the byte-code and converts it into a native code, the JIT could provide direct native code without involving re-interpretation. The JIT Compiler consists of the following components:
a. Intermediate Code Generator: It generates the intermediate code.
b. Code Optimizer: It optimizes the intermediate code for better performance.
c. Target Code Generator: It converts the intermediate code to the native machine code.
d. Profiler: It identifies the hotspots(the code segments that are executed repeatedly).
3. Garbage Collector in Java:
It destroys the un-references objects. The process of garbage collection involves two phases:
- Mark – Here, the GC identifies the unused objects in the memory.
- Sweep – Here, the GC removes the objects that are identified during the previous phase.
The process of garbage collection automatically takes place at regular intervals. The system triggers it by using the System.gc(), yet we cannot guarantee the execution.
It consists of four types of garbage collectors:
a. Serial Garbage Collector
The garbage collection process takes place in a single thread in a serial order. It is mostly used in simple programs. The XX:+UseSerialGC JVM argument activates it.
b. Parallel / Throughput Garbage Collector
It is the default garbage collector opted for by the JVM. It uses multiple threads for major garbage collection. Most likely to execute long processes. To activate the Parallel GC, the -XX:+UseParallelGC, we must execute the JVM argument.
c. Concurrent Mark Sweep (CMS) Garbage Collector
It uses multiple threads to first scan the unwanted instances to eradicate them. It allows the garbage collection thread to execute concurrently while the application’s thread is running. The -XX:+UseParNewGC or the -XX:+ParallelCMSThread=<n> JVM argument activates it.
d. Garbage First (G1) Garbage Collector
The G1 GC is helpful when there is a large chunk (more than 4GB) of garbage to clear. This takes place by dividing the heap into equal partitions to collect the garbage in prioritized order. The -XX:+UseG1GC JVM argument activates it.
On the basis of execution, the motor uses a couple of strategies:
- Understanding: Here, the execution motor changes each order to the machine dialect.
- Just In Time (JIT) Compiling: The execution motor orders the changes to the local code and stores them in the reserve. From this point, all the changes that are related to this technique execute directly.
Though JIT takes excess time than translation, it executes only once for a technique that can be called multiple numbers of times. This kind of strategy saves a great deal of execution time contrasted with deciphering each charge one by one each time it takes place.
JVM Working:
Here is a brief explanation to denote the working of the JVM:
Whenever we compile a .java file, a .class file that contains the byte-code with the same class names as present in .java file is generated by the compiler. This .class file undergoes various steps during the execution.

Java Native Interface (JNI):
This interface interacts with the Native Method Libraries (collection of C and C++ libraries required for engine execution) and provides the ones needed for the execution. The other role of this interface is to enable the JVM to call C/C++ libraries that are hardware-specific.
JVM Screen in Java:
1. Total Memory Utilization (MB):
This is the measure of memory that JVM employs. It influences the general execution of the hidden OS if the JVM consumes all the memory.
2. Heap Memory Utilization (MB):
This is the measure of the memory that JVM allocates for the objects that are utilized by the running Java application. On the off chance that this metric develops, it can demonstrate whether the application is expelling references for unused items or it is designed to work appropriately.
3. Non-Heap Memory Use (MB):
This is the measure of the memory that is allocated to the method zone and the code reserve. It uses store references to the stacked classes.
4. Total Pool Memory Utilization (MB):
Various memory pools use the memory that designates the JVM. It gives an idea of how much memory the application could expand without the JVM overhead.
5. Strings:
It contains the number of dynamic strings in the JVM. It provides an idea of the number of solicitations that are present and whether it influences the foundation errands that are running in strings set to a lower priority or need.
JVM Errors:
These are certain JVM errors that you would encounter:
1. ClassNotFoundException
The errors occurs when the Class Loader is trying to load the classes using Class.forName(), ClassLoader.loadClass() or ClassLoader.findSystemClass() but in the absence of definition for the class with the specified name.
2. NoClassDefFoundError
This error occurs when a compiler has successfully compiled the class, but the ClassLoader is unable to locate the class file during the runtime.
3. OutOfMemoryError
This error occurs when the JVM cannot allocate an object as there is no memory space left
4. StackOverflowError
This error occurs if the JVM runs out of space while creating new stack frames while processing a thread.
Conclusion
This article has elaborately explained the Java Virtual Machine’s architecture and its various components. Though it is not mandatory for everyone to know about the working of the JVM, having a brief idea about it helps when your internal code doesn’t work.